Audio as Visual
April 9, 2008 1:50 PM Subscribe
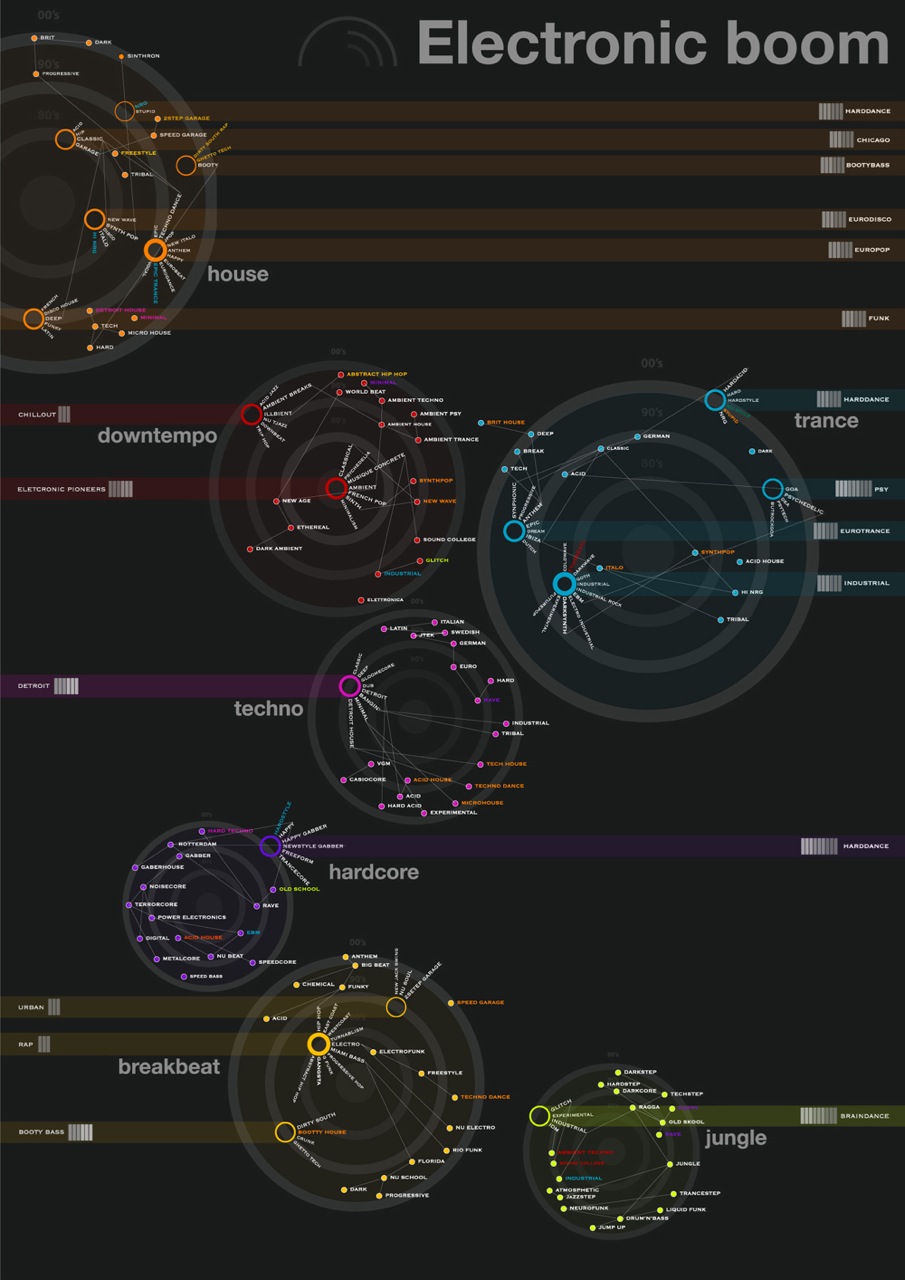
The intersect of data visualization and aural phenomena is a fascinating space, from simple chartings of the history of sampling to mapping the entire world of music (or even just electronica). Pop songs become sketches, iTunes libraries become twisted geometric forms, and last.fm listening behaviors form coloured orbs and waves. The collaborative networks of comtemporary rappers, jazz musicians, and classical composers are revealing of specific and meaningful community structures. Explore the algorithmic music of Stephan Wolfram's computational universe, listen to pi or e or the Mona Lisa or the weather or the temperature in New York City, discover the shape of sound, or just, you know, see music.
Use the Echo Nest to visualize your own music (example), tag your music collection with colours, or just wade through the plethora of ways to map connections between artists and genres. (several previously)
Fantastic post. Tks.
posted by elmono at 2:12 PM on April 9, 2008 [1 favorite]
posted by elmono at 2:12 PM on April 9, 2008 [1 favorite]
The visualizations from flyingpudding.com are pretty cool. Anyone want to speculate with me about the details of the timbre -> color matching? First guess: It's based on the overall power spectrum at that time slice (i.e., they're not decomposing it into notes again, a la Melodyne, which is why you don't see warm and cool colors in the same column), the brightness is simply the energy in band (from FFT), and the high frequencies correspond to the red end of the color spectrum.
I'd really like to see it done after a Melodyne note-extraction analysis, actually. Then you could analyze timbres relative to the note's fundamental, and—heck, take them all the way through a cepstral analysis, and you could make saturation correspond to harmonicity and value correspond to spectral density. Ooh, and then you could shorten the timescale so that percussive attacks would show up as a white front edge ... mmm, tasty.
yep, I'm a nerd
posted by eritain at 2:58 PM on April 9, 2008
listen to pi or e or the Mona Lisa or the weather or the temperature in New York City
This is a waste of time. There is no understanding to be gained from converting these sorts of signals into audio, and it doesn't even sound good.
posted by demiurge at 2:59 PM on April 9, 2008
This is a waste of time. There is no understanding to be gained from converting these sorts of signals into audio, and it doesn't even sound good.
posted by demiurge at 2:59 PM on April 9, 2008
(nb: I am a cofounder of the echo nest)
The visualizations from flyingpudding.com are pretty cool. Anyone want to speculate with me about the details of the timbre -> color matching? First guess: It's based on the overall power spectrum at that time slice (i.e., they're not decomposing it into notes again,
As far as I know Anita is using some function of timbre and pitch data from the Echo Nest Analyze XML per segment. It may just be the first 3 bins of the timbre data mapped to RGB. You can see a pretty good description of the data in the XML on our developer site (where you can make your own analyses.) We also have parsers in Python, Flash, Processing and Objective C.
I put up a Mefi project for the launch of the analyze API and This Is My Jam, a site that makes audio use of the API to make mini-beatmatched mixes.
posted by brianwhitman at 3:11 PM on April 9, 2008
oh PS we have a page full of examples of different stuff (audio and visual) made using the Analyze API)
posted by brianwhitman at 3:15 PM on April 9, 2008
posted by brianwhitman at 3:15 PM on April 9, 2008
...listen to pi or e or the Mona Lisa or the weather or the temperature in New York City...
There is no understanding to be gained from converting these sorts of signals into audio...
Understanding shmunderstanding. You just put a beat under it and dance. Dance the night away!
posted by flapjax at midnite at 4:30 PM on April 9, 2008
There is no understanding to be gained from converting these sorts of signals into audio...
Understanding shmunderstanding. You just put a beat under it and dance. Dance the night away!
posted by flapjax at midnite at 4:30 PM on April 9, 2008
Very good point. To get understanding, data alone isn't enough. Transforming sound data into information, real comprehension, is something humans can only do in certain ways - cat pi > /dev/dsp isn't one of them.
Good design of sonifications requires designers to consider not only what fundamental information that needs to be communicated, but also the abilities and limitations of the human aural system. This scientific journal article shows some very promising up and coming research in how to design effective medical and aerospace alarms. More here and here.
posted by anthill at 5:33 PM on April 9, 2008 [1 favorite]
I really wish Penny Sanderson (the main researcher in the above work) would post some sound samples online - her work is obviously better heard than seen.
posted by anthill at 5:34 PM on April 9, 2008
posted by anthill at 5:34 PM on April 9, 2008
I'm loathe to self-link in general... but given the context of this post, I think I'm still staying on-topic here.
Last July, I created a project entitled "Astronaut" that takes a friend's song and visualizes the lyrics based on keywords via Flickr. I was listening obsessively to this song, and happened to be digging around the Flickr API at the same time. If anyone's interested, there's a bit more backstory/context in this blog post.
Also - as a brief aside - the pi10k project originated from my early days learning Flash/Actionscript. It was mostly born out of me wanting to learn how to better manipulate strings/arrays. To this day, I'm in awe that something which originated as a personal exercise is still making the rounds.
posted by avoision at 7:48 PM on April 9, 2008
Yeah, that fucking waves thing for last.fm? I put in my request three weeks ago when this was last posted and it still hasn't rendered.
posted by klangklangston at 11:10 PM on April 9, 2008
posted by klangklangston at 11:10 PM on April 9, 2008
"A collection of adjacent k=3 k-cliques centering on the rapper RZA found using the clique percolation method after the weighted edge disparity algorithm is run for X = 50."
Coolest. Graph. Ever.
posted by jonp72 at 8:28 AM on April 10, 2008
Coolest. Graph. Ever.
posted by jonp72 at 8:28 AM on April 10, 2008
« Older Alas! regardless of their doom, the little victims... | Diver Bill Newer »
This thread has been archived and is closed to new comments
Figure 3. The Wu-Tang Clan and their neighbours. Plotted with the Kamada-Kawai graphing algorithm.
This is so many different kinds of geeky cool that I just had to breathe into a paper bag for a few moments upon reading it.
Neat post. thanks.
posted by googly at 1:57 PM on April 9, 2008