Pretty Numbers
August 21, 2012 3:50 PM Subscribe
The Information Is Beautiful 2012 Awards shortlist has been announced. Featuring lists categorized by
longlist
informationisbeautiful (previously lots)
- Infographic infodesign
- Data visualisation
- Interactive visualisation
- Data journalism
- Motion infographic
- Tool or website
longlist
informationisbeautiful (previously lots)
I wish they could've found some way to merge this with the "Information is Navigable" awards.
posted by jjjjjjjijjjjjjj at 4:14 PM on August 21, 2012 [8 favorites]
posted by jjjjjjjijjjjjjj at 4:14 PM on August 21, 2012 [8 favorites]
These things provide me with the brief but pleasurable illusion that the world is a more rational place than it really is.
posted by Egg Shen at 4:17 PM on August 21, 2012 [1 favorite]
posted by Egg Shen at 4:17 PM on August 21, 2012 [1 favorite]
Presenting the infographics as tiny slivers with no identifying information is rather like renovating the Louvre so that the artwork can only be seen through binoculars behind the smoke of a thousand burning books. From a watch tower.
posted by Hollywood Upstairs Medical College at 6:04 PM on August 21, 2012 [2 favorites]
posted by Hollywood Upstairs Medical College at 6:04 PM on August 21, 2012 [2 favorites]
Questioning the choices InformationIsBeautiful.net makes on their own publications is all part of the fun!
posted by carsonb at 6:28 PM on August 21, 2012
posted by carsonb at 6:28 PM on August 21, 2012
saw this earlier this week. its really great stuff... sometime a little heavy on the infoviztubation but fun never the less. Also - videos from this years eyeo festival: http://vimeo.com/eyeofestival
posted by specialk420 at 8:41 PM on August 21, 2012
posted by specialk420 at 8:41 PM on August 21, 2012
Glorious to look at but hardly informative. "Chaos and structure" comes with big sound and crickets, but I've no idea what it as trying to convey...
posted by marvin at 8:47 PM on August 21, 2012
posted by marvin at 8:47 PM on August 21, 2012
I was about to say the exact same thing as Marvin. A good visualization should allow me to interpret the data more easily. This and this sure do look cool, but provide no insight.
posted by KGMoney at 8:49 PM on August 21, 2012
posted by KGMoney at 8:49 PM on August 21, 2012
Shouldn't the Information Is Beautiful contest actually represent information?
I looked through the first row of the Data Visualization category:
What's in a Surname? - Distorts information by implying sub-state level data was used (putting the three Hispanic last names from Florida all in Miami, or the three Irish last names in New England all in Boston).
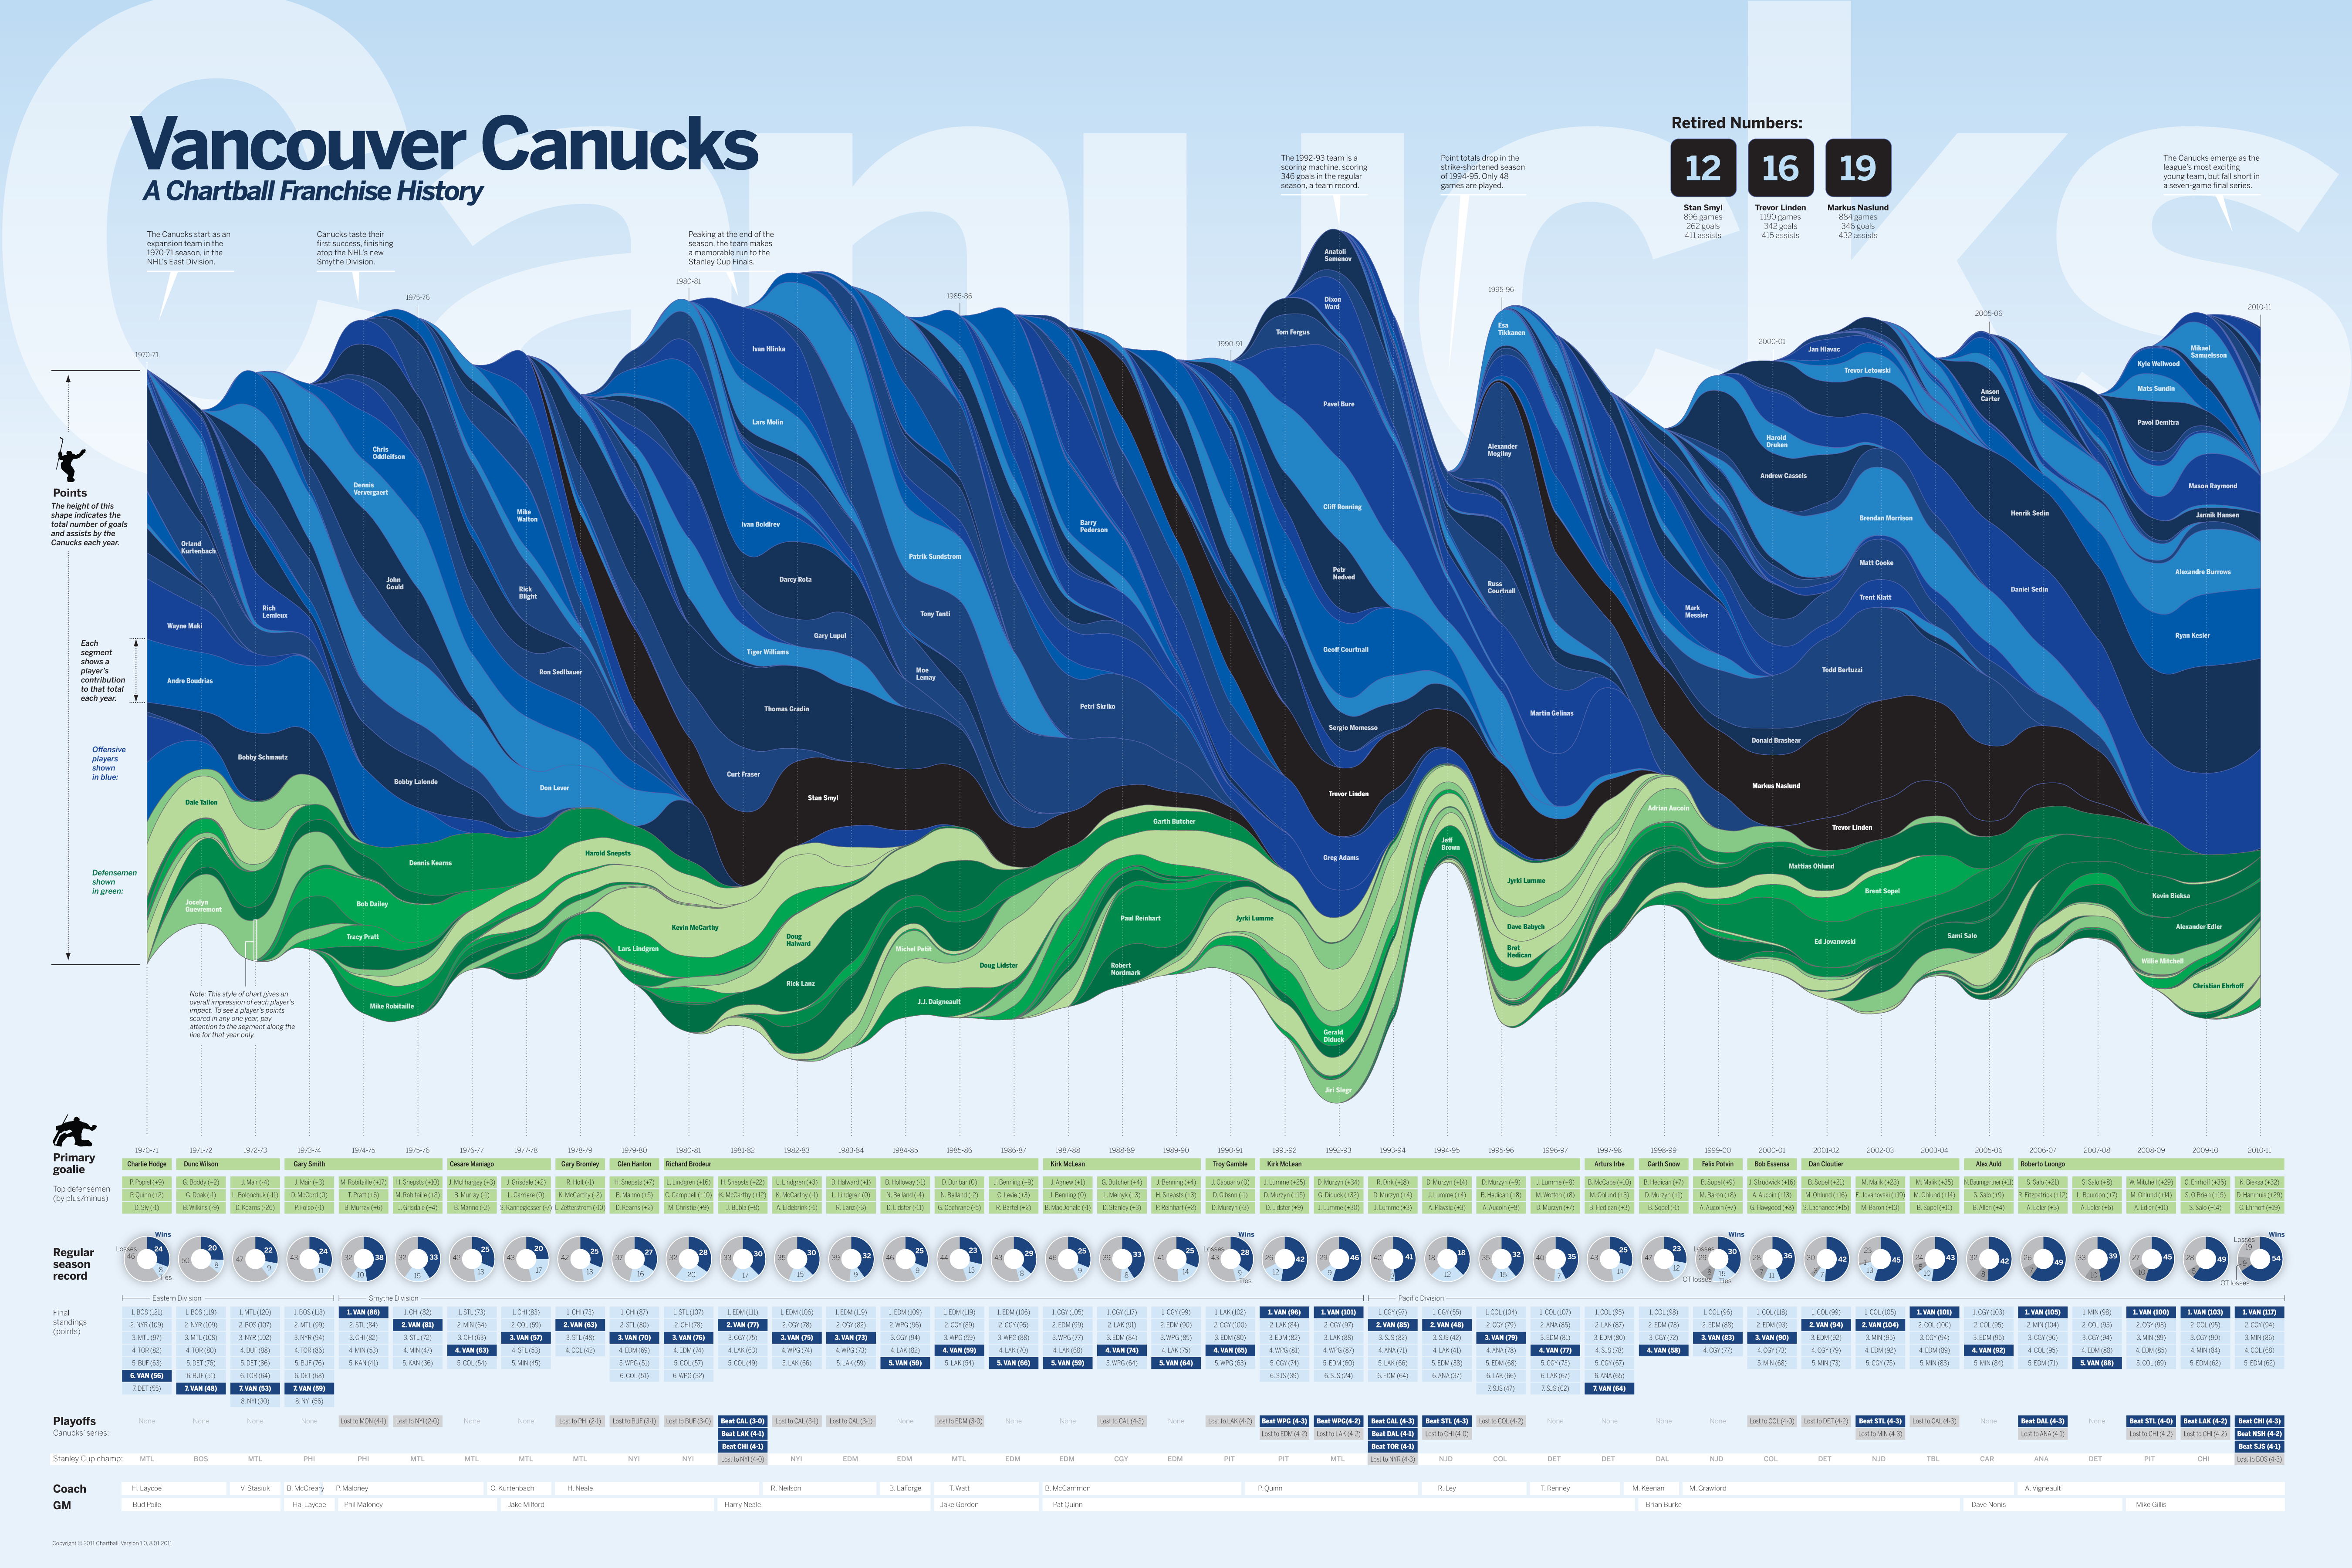
Vancouver Canucks - too small to read on this site.
When Does Crime Happen? - Pretty clearly either incorrect data parsing, inconsistent crime coding or false accuracy (Indianapolis spikes imply that 2-hour data is being shown as hourly; San Francisco has unreasonable level of assault, my guess is that there is a definitional issue.)
Transfer Calligraphy - implies a geographic dimension - and would otherwise best be suited as a simple line graph or something - but the geography is not legible and is distorted.
Track & Field - Not too bad, assuming that the smaller figures (e.g. high jump) are visible since it was printed in a magazine, but projecting scatter plots into 3 dimensions distorts the information; pole vault heights look like they've increased more like 150% instead of the 71% in reality.
Top Marginal Tax Rates - A clear presentation of a complex topic; the note explaining what a marginal tax rate is is very helpful; the military spending graph could use an axis but otherwise great.
So one of six was actually a correct display of information. Some of the others below are also real howlers; the headscarf graphic is a great image, but does not actually display information visually - the image and the facts are totally at odds with each others.
If this is the shortlist, I'd sure hate to see what the longlist had on it.
posted by Homeboy Trouble at 1:09 AM on August 22, 2012 [4 favorites]
I looked through the first row of the Data Visualization category:
What's in a Surname? - Distorts information by implying sub-state level data was used (putting the three Hispanic last names from Florida all in Miami, or the three Irish last names in New England all in Boston).
Vancouver Canucks - too small to read on this site.
When Does Crime Happen? - Pretty clearly either incorrect data parsing, inconsistent crime coding or false accuracy (Indianapolis spikes imply that 2-hour data is being shown as hourly; San Francisco has unreasonable level of assault, my guess is that there is a definitional issue.)
Transfer Calligraphy - implies a geographic dimension - and would otherwise best be suited as a simple line graph or something - but the geography is not legible and is distorted.
Track & Field - Not too bad, assuming that the smaller figures (e.g. high jump) are visible since it was printed in a magazine, but projecting scatter plots into 3 dimensions distorts the information; pole vault heights look like they've increased more like 150% instead of the 71% in reality.
Top Marginal Tax Rates - A clear presentation of a complex topic; the note explaining what a marginal tax rate is is very helpful; the military spending graph could use an axis but otherwise great.
So one of six was actually a correct display of information. Some of the others below are also real howlers; the headscarf graphic is a great image, but does not actually display information visually - the image and the facts are totally at odds with each others.
If this is the shortlist, I'd sure hate to see what the longlist had on it.
posted by Homeboy Trouble at 1:09 AM on August 22, 2012 [4 favorites]
Information is blue? Looks like someone has sold out to Sir Martin Sorrell.
posted by tapeguy at 2:11 AM on August 22, 2012
posted by tapeguy at 2:11 AM on August 22, 2012
Apparently I am mistaken in my thinking that information graphics should, first and foremost, clarify the data and present the data in a directly understandable format. I guess I've been doing it wrong for so many years...
posted by Thorzdad at 3:20 AM on August 22, 2012 [1 favorite]
posted by Thorzdad at 3:20 AM on August 22, 2012 [1 favorite]
tapeguy - Kantar and Neilsen were very, very late to the visualization game and are having to do a lot of work to convince their clients that they understand what consumer insight in 2012 looks like. See also: Nielsen Data Visualization Contest.
posted by MuffinMan at 4:31 AM on August 22, 2012
posted by MuffinMan at 4:31 AM on August 22, 2012
Vancouver Canucks - too small to read on this site.
I think your browser is doing some auto re-sizing on you. If anything, it's too BIG to read on a computer screen (it's 5400 by 3600 pixels).
posted by juv3nal at 1:45 PM on August 22, 2012
I think your browser is doing some auto re-sizing on you. If anything, it's too BIG to read on a computer screen (it's 5400 by 3600 pixels).
posted by juv3nal at 1:45 PM on August 22, 2012
I think your browser is doing some auto re-sizing on you. If anything, it's too BIG to read on a computer screen (it's 5400 by 3600 pixels).
I'm getting the same problem that Homeboy Trouble had. The awards site only has (or at least will only serve me) .jpg files up to 1024 pixels on the long side. This is what I get for the Canucks chart, this for the surname chart, etc. Every single one I've looked at is not fully readable at that resolution, and many are downright useless.
Some of the nominees have links to a full-size version; either a direct link to an image file (Canucks), a link to the page of a dynamic chart (When Does Crime Happen?), or a link to the artist's personal site where you can eventually get to the full-size version (Family Tree Diagram of Greek Mythology). But many, if not most, of the nominees do not have any way of accessing the full-size version.
posted by clorox at 9:05 PM on August 27, 2012
Some of the nominees have links to a full-size version; either a direct link to an image file (Canucks)
Yeah that was the one I was referring to. I figured the one on the informationisbeautifulawards site was basically a thumbnail.
On googling, it seems there is a zoomable version of the surname chart here, but the award site doesn't link to it.
posted by juv3nal at 10:39 PM on August 27, 2012
Yeah that was the one I was referring to. I figured the one on the informationisbeautifulawards site was basically a thumbnail.
On googling, it seems there is a zoomable version of the surname chart here, but the award site doesn't link to it.
posted by juv3nal at 10:39 PM on August 27, 2012
« Older Welcome to the National Hobo Convention | They had a Carl Sagan, too Newer »
This thread has been archived and is closed to new comments
posted by iamkimiam at 4:04 PM on August 21, 2012 [1 favorite]